Податотека:Snells law wavefronts.gif

Snells_law_wavefronts.gif (225 × 227 пиксели, големина: 65 КБ, MIME-тип: image/gif, кружно, 10 кадри, 0,1 с)

Врска до Ризницата Ова е податотека од Ризницата на Викимедија и може да се користи на други проекти. Подолу е наведена содржината на нејзината описна страница.
Заедничката ризница е складиште на слободно-лиценцирани слики и снимки. И Вие можете да помогнете.

Titel

Опис

 
Оваа GIF графика е изработена со MATLAB.
Опис
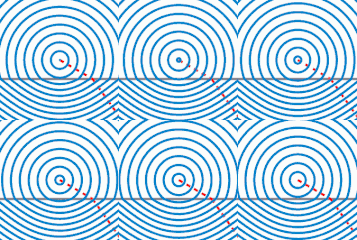
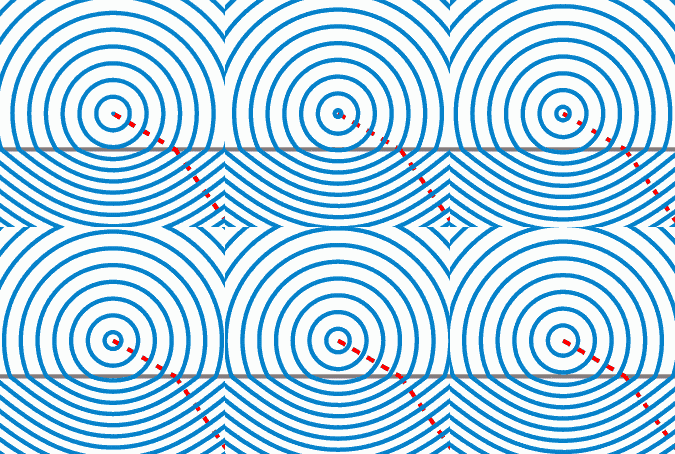
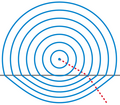
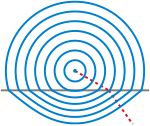
English: Illustration of wavefronts in the context of Snell's law.
Датум (UTC)
Извор Own work, created with MATLAB. (Source code below.)
Автор Oleg Alexandrov
Дозвола
(Повторно користење на податотекава)
Public domain Јас, праводржецот на ова дело, го предавам истото во јавна сопственост. Ова важи за целиот свет.
Во извесни земји ова не е правно изводливо. Во тој случај:
Дозволувам секому да го користи делово за каква било цел, без какви било услови, освен ако такви услови не ги налага законот.
Други верзии
Постои и векторска (SVG) верзија на сликава.
Таа треба да се користи наместо оваа растерска слика, освен ако не е полоша од неа.

File:Snells law wavefronts.gif → File:Snells law wavefronts.svg

За повеќе информации за векторската графика, прочитајте за преодот на Ризницата кон SVG формат.
На располагање ви се и информации за поддршката на SVG слики на МедијаВики.

На други јазици
Alemannisch  العربية  беларуская (тарашкевіца)  български  বাংলা  català  нохчийн  čeština  dansk  Deutsch  Ελληνικά  English  British English  Esperanto  español  eesti  euskara  فارسی  suomi  français  Frysk  galego  Alemannisch  עברית  hrvatski  magyar  հայերեն  Bahasa Indonesia  Ido  italiano  日本語  ქართული  한국어  lietuvių  македонски  മലയാളം  Bahasa Melayu  norsk bokmål  Plattdüütsch  Nederlands  norsk nynorsk  norsk  occitan  polski  prūsiskan  português  português do Brasil  română  русский  sicilianu  Scots  slovenčina  slovenščina  српски / srpski  svenska  தமிழ்  ไทย  Türkçe  татарча / tatarça  українська  vèneto  Tiếng Việt  中文  中文(中国大陆)  中文(简体)  中文(繁體)  中文(马来西亚)  中文(新加坡)  中文(臺灣)  中文(臺灣)  +/−
Нова SVG слика

Source code

% Illustration of Snell's law
function main()

   % indexes of refraction
   n1=1.0;
   n2=1.5;

   sign = -1;% is the source up or down?
   O=[0, -1*sign];
   k=500;

   
% KSmrq's colors
   red    = [0.867 0.06 0.14];
   blue   = [0, 129, 205]/256;
   green  = [0, 200,  70]/256;
   yellow = [254, 194,   0]/256;
   white = 0.99*[1, 1, 1];
   black = [0, 0, 0];
   gray = 0.5*white;

   color1=red;
   color2=blue;
   color3=gray;
   lw = 3;
   
   plot_line=0;
   Theta=linspace(0, 2*pi, k);
   V=0*Theta; W=0*Theta;
   S0=7;
   spacing=0.45;
   p=floor(S0/spacing);
   S=linspace(0, S0, p+1);
   spacing=S(2)-S(1);
   
   num_frames = 10;
   for frame_iter=1:num_frames

      figure(1); clf; hold on; axis equal; axis off;

      % plot the interface between diellectrics
      L=1.2*S0;
      plot([-L, L], [0, 0], 'color', color3, 'linewidth', lw);
      
      
      % plot a ray
      plot_line=1;
      s=L;
      theta=pi/3; wfr(s, theta, n1, n2, O, sign, plot_line, color1, lw);

      % plot the wafefronts
      plot_line=0;
      for i=1:p

	 s=S(i)+spacing*(frame_iter-1)/num_frames;

	 for j=1:k
	    theta=Theta(j);
	    [V(j), W(j)]=wfr(s, theta, n1, n2, O, sign, plot_line, color1, lw);
	 end
	 plot(V, W, 'color', color2, 'linewidth', lw);
      end
      

      %  dummy points to enlarge the bounding box
      plot(0, S0+2.5*spacing, '*', 'color', white);
      plot(0, -(S0+2.5*spacing)/n2, '*', 'color', white);

      % to know where to crop later
      Lx=3.2; Ly=Lx; shift = 1;
      plot([-Lx, Lx, Lx, -Lx -Lx], ...
           [-Ly, -Ly, Ly, Ly, -Ly]+shift);

      file = sprintf('Frame%d.eps', 1000+frame_iter);
      disp(file);
      saveas(gcf, file, 'psc2')
   end
end

% Converted to gif with the UNIX command
% convert -density 100 -antialias Frame10* Snell_animation.gif 
% then cropped in Gimp

function [a, b]=wfr(s, theta, n1, n2, O, sign, plot_line, color1, lw);

   X=O+s*[sin(theta), sign*cos(theta)];

  if( sign*X(2) > 0 )
    t=-sign*O(2)/cos(theta);
    X0=O+t*[sin(theta), sign*cos(theta)];
    
    if (plot_line == 1) 
      plot([O(1), X0(1)], [O(2), X0(2)], 'color', color1, 'linewidth', lw, 'linestyle', '--');
    end

    d = norm(O-X0);
    r = (s-d)*(n2/n1)^(sign);

    theta2=asin(n1*sin(theta)/n2);
    XE=X0+r*[sin(theta2), sign*cos(theta2)];
  else
    XE = X;
  end  
  a = XE(1);
  b = XE(2); 

  if (plot_line==1)
    plot([X0(1), XE(1)], [X0(2), XE(2)], 'color', color1, 'linewidth', lw, 'linestyle', '--');
  end  
end

Описи

Опишете во еден ред што претставува податотекава
Wavefronts from a point source of light.In a particuler wavefront u will see that the dist btw source & wavefront above the line is > dist btw source & wavefront below the line beacuse lightspeed is greater in the above and lower in below.

Предмети прикажани на податотекава

прикажува

Историја на податотеката

Стиснете на датум/време за да ја видите податотеката како изгледала тогаш.

Датум/времеМинијатураДимензииКорисникКоментар
тековна10:59, 5 јули 2009Минијатура на верзијата од 10:59, 5 јули 2009225 × 227 (65 КБ)Capmoreduced to 16 colors with no quality loss
07:31, 2 јануари 2008Минијатура на верзијата од 07:31, 2 јануари 2008225 × 227 (148 КБ)Oleg Alexandrov{{Information |Description=Illustration of wavefronts in the context of Snell's law. |Source=self-made with MATLAB |Date=05:36, 1 January 2008 (UTC) |Author= Oleg Alexandrov |Permission= |oth

Податотекава се користи во следнава страница:

Глобална употреба на податотеката

Оваа податотека ја користат и следниве викија:

Погледајте ја останатата глобална употреба на податотекава.